Custom Dashboards vs. SaaS
Custom Dashboards vs. Off-The-Shelf SaaS: Which Makes Sense For Your Operations?
It’s Monday morning. You want a clear picture of your business.
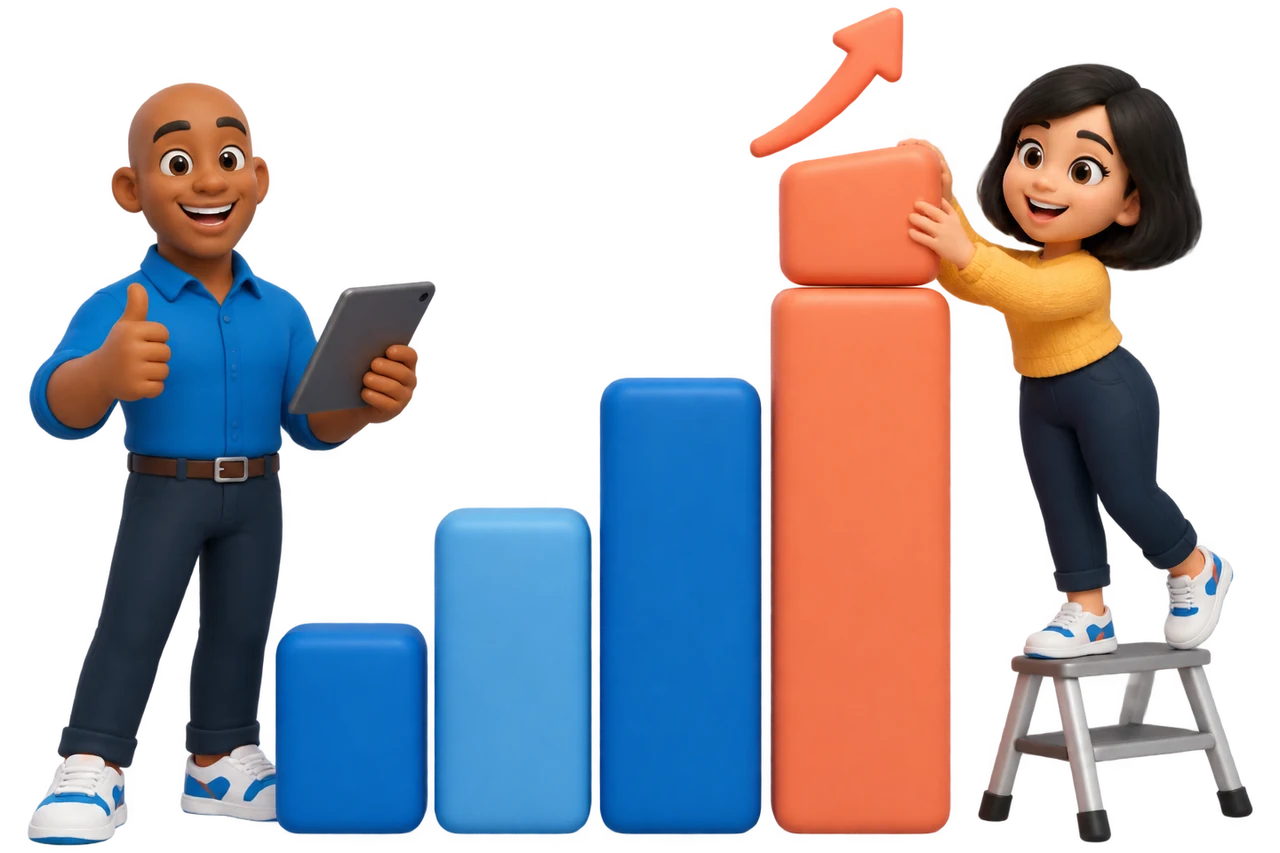
Instead, you have six tabs open, two spreadsheets downloading and a dashboard that cheerfully tells you everything is “on track.”
Everything except the number you actually need.
- CRM
- Scheduling
- Accounting
- Sales report
- temporary-final.xlsx
- Dashboard
Everything is on track
- SalesOn track
- BookingsOn track
- InvoicesOn track
- The number you need?
- branch-sales.xlsx
- timesheets.xlsx
You know the information exists somewhere. It might be in your CRM, your scheduling system, your accounting software or that spreadsheet someone promised was only temporary.
The question is: should you bring it together with an existing software platform, or build a dashboard around the way your business operates?
Both can be smart choices. The right answer depends on what you need to see, what you need to do with it and how much the available tools fit your workflow.
At Clickative, we build custom dashboards, applications and integrations for businesses that need their systems to work better together. We also know that custom development makes the most sense when there’s a genuine reason to build it.
01The Real Question
First, What Are You Actually Trying To Solve?
“I need a dashboard” can mean a lot of different things.
One business might want monthly sales figures. Another needs to track multiple teams and identify issues needing attention.
Before we think about charts or technology, we start with the decisions behind them:
-
The Questions
What questions does your team need answered?
-
The Sources
Where does that information currently live?
-
The Timing
How often does it need to be updated?
-
The Audience
Who needs to see it?
-
The Next Step
What should someone do when a number needs attention?
The last question is easy to miss. A dashboard that tells you something went wrong is useful. A dashboard that also helps the right person investigate and respond can become part of how the business operates.
The best dashboard is the one that helps your team make the next decision.
02Off-The-Shelf
Where Off-The-Shelf Software Shines
Let’s give ready-made software its due: it can be a fantastic choice.
An established reporting platform may already connect to your systems and let your team create the reports they need.
An off-the-shelf platform could be a good fit when:
Supported Connectors
Your data sources are supported by available connectors.
Features That Fit
Your reporting needs fit the platform’s features.
Reports Your Team Builds
Your team wants to create and adjust reports independently.
Permissions That Work
The available permissions work for your users and data.
A Budget That Fits
The subscription and any related costs fit your budget.
You may still need help preparing data, configuring access or designing useful reports. But the underlying platform gives you a starting point, and the provider manages much of the software itself.
For many businesses, that’s exactly the right answer.
03When It Gets Complicated
Where Things Start To Get Complicated
Now imagine a business that runs several locations, each with its own schedules, sales activity and operational targets.
The owner wants to see the entire business. Regional managers need their own locations. Individual team members need a focused view of the tasks they can actually act on.
The Owner
The entire business, every location.
Regional Managers
Their own locations.
Team Members
The tasks they can actually act on.
And the numbers need to combine information from several systems, each with its own definitions.
A reporting platform may handle some or all of that. The question is whether it fits the operation, data and budget.
Sometimes the sticking point is the connection. Sometimes it’s a calculation that needs more work upstream. Sometimes it’s the experience around the data: people want to investigate a record, make a decision or trigger an action without jumping between applications.
This is where the conversation can move from “Which chart should we use?” to “What should this tool actually help us do?”
04A Custom Dashboard
What A Custom Dashboard Can Bring To The Table
A custom dashboard is designed around a particular business and its users. For this comparison, we’re talking about a purpose-built application or interface, which may connect to existing services and reporting tools.
That gives you room to shape the experience around your operation:
Your Workflow
Put the information and actions your team needs in the same place.
Your Metrics
Define calculations around the way your business measures performance.
Your Users
Give different teams relevant views and permissions.
Your Systems
Connect available data sources and existing applications.
Your Brand
Create an interface that feels like part of your business.
Imagine a staffing company that wants to see open shifts, upcoming deadlines and exceptions across multiple branches. A manager could open a branch view, find a shift needing attention and move directly into the relevant workflow.
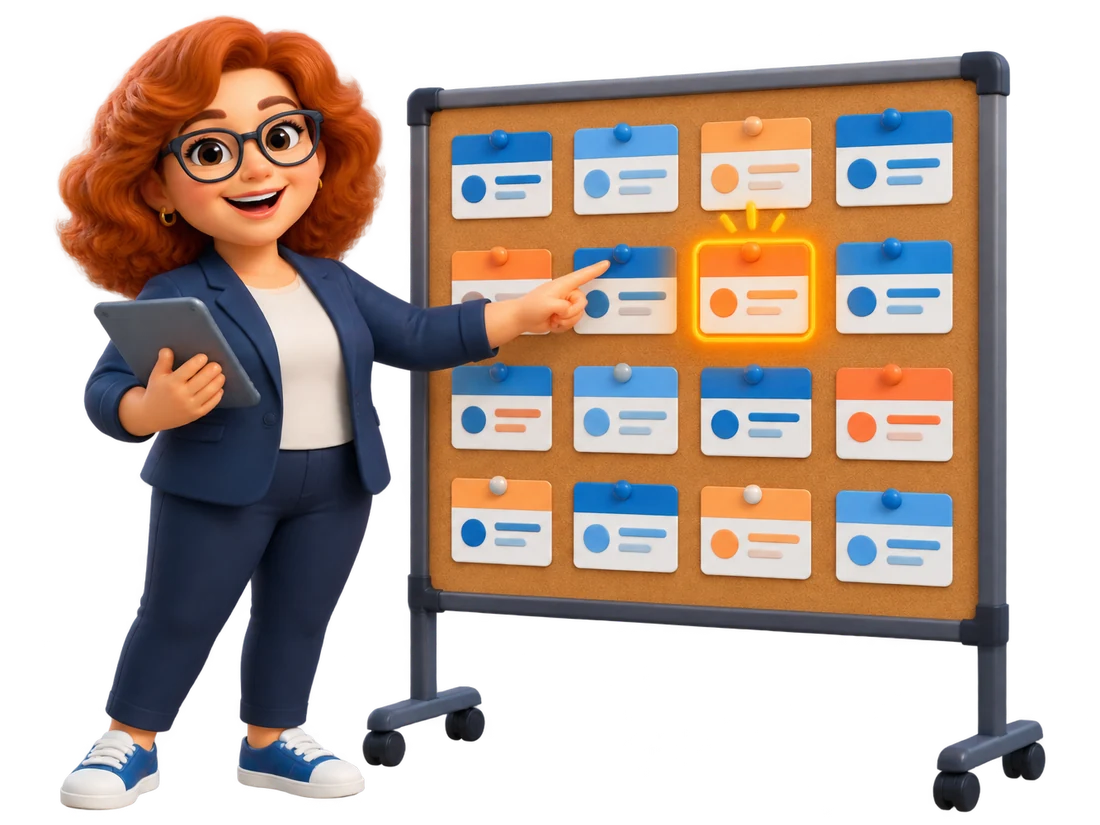
That’s a hypothetical example, but it shows why a dashboard can be more than a collection of charts. It can be a working interface for the decisions and actions surrounding the data.
When we design a dashboard, we look at what should happen after someone notices a problem. The answer might lead to a detail view, an alert, an approval or a link into an existing system.
05At A Glance
The Comparison At A Glance
| Question | Off-The-Shelf SaaS | Custom Dashboard |
|---|---|---|
| Getting started | An existing platform provides a starting point | Needs planning, design and development |
| Features | Depends on the product and plan | Shaped around the agreed project scope |
| Data connections | Uses available connectors or additional integration work | Can be designed around available APIs and data access |
| User experience | Configured within the platform’s options | Can be tailored to roles and workflows |
| Costs | Usually includes subscription or usage charges | Includes build costs and ongoing operating costs |
| Maintenance | Provider maintains the platform; your team still manages its use and configuration | The business needs an arrangement for hosting, updates and support |
| Changes | Depends on available configuration and the provider’s roadmap | Can be prioritised and developed for your business |
Neither column tells the whole story on its own. An existing platform can be highly configurable, and a custom application can still rely on third-party services.
06The Real Cost
The Cost Question Goes Beyond The Monthly Price
Look beyond the subscription price or initial development quote.
For an off-the-shelf platform, consider licences, paid connectors, implementation, training and potential usage charges.
For a custom dashboard, consider the initial build, hosting, third-party services, maintenance, support and future changes.
Off-The-Shelf Platform
- Licences
- Paid connectors
- Implementation
- Training
- Usage charges
Total over time
Custom Dashboard
- Initial build
- Hosting
- Third-party services
- Maintenance
- Support
- Future changes
Total over time
Licensing details vary. For example, Microsoft’s Power BI documentation describes different requirements for sharing reports depending on user licences and the capacity hosting the content. It’s worth checking the actual arrangement for everyone who needs access.1
The useful comparison is the total cost over a period that makes sense for your business, alongside the value each option delivers.
A custom build isn’t automatically cheaper, and a subscription isn’t automatically the more expensive choice.
07The Data Behind It
A Beautiful Dashboard Is Only As Useful As Its Data
Here’s the part that can surprise people: changing the dashboard doesn’t automatically fix the information feeding it.
If two systems calculate revenue differently, putting their figures on the same screen won’t decide which definition your business wants to use. If an update arrives late, a polished chart can still show an outdated picture.

This applies whether you buy a platform or build a custom interface.
When we work with a client, we look at the information behind the display: where it comes from, how key metrics are defined and what “current” needs to mean for the people using it.
Some decisions need near-immediate information; others work with a daily update. Google notes that freshness options can vary by connector.2
A useful dashboard should make the freshness of its information understandable, especially when someone is about to act on it.
08Do Both
The Option People Often Overlook: Do Both
The choice doesn’t have to be all or nothing.
You might use an established reporting platform for flexible analysis while building a custom operational dashboard for the team that needs a simpler daily view.
Reporting PlatformFlexible analysis
Custom InterfaceA simpler daily view
BothOr you might keep the systems you already rely on and add a custom interface that brings selected information and actions together.
A hybrid approach can be useful when:
Some Reporting Works
Your existing platform already handles some reporting well.
Teams Need Different Views
Different teams need different experiences.
One Workflow Needs More
A specific workflow needs a more tailored interface.
Improve One Part At A Time
You want to improve part of the operation without replacing every tool.
The details matter. Embedding, licensing, permissions and the ability to connect systems depend on the products and plans involved. Metabase, for example, documents specific permissions and plan requirements for parts of its embedding features.3
Our starting point is to understand what is already working and where the gaps are. That gives us a better foundation for deciding what to connect, configure or build.
09How We Build It
How We Approach Dashboard Projects
We start with the business, the people using the information and the decisions they need to make.
From there, our process moves through four stages:
- ImagineUnderstand your goals, data sources and workflows.
- DesignShape a clear interface around the people who will use it.
- BuildConnect the agreed data, functionality and services.
- RefineReview and test the experience, from the big picture down to the details.
We use AI to support development work including research, code drafts and testing. Our team guides the architecture, data modelling, security review and user experience decisions.
The goal is a dashboard your team actually wants to open, because it helps them understand what’s happening and decide what to do next.

Let’s Make Your Data More Useful
If your reporting lives across too many tabs, or your current dashboard is close to what you need but never quite gets there, let’s talk.
Tell us about your systems and the decisions your team needs to make.
We’ll put together a FREE concept proposal with visual directions and functional ideas before you commit.